Wavefront And Spring Boot
Observing Spring Boot applications with Wavefront.
Wavefront is a Software as a Service (SaaS) product that is part of the new Tanzu portfolio of products from VMware. It enables the monitoring of applications. Unlike Prometheus, the database is entirely managed for you. While Prometheus may work well during the initial setup, it quickly can become overwhelmed by mountains of production data.
Wavefront has several components.
- The Wavefront SaaS Product
- The Wavefront proxy
- SDKs and Integrations.
Working with integrations in Wavefront gives plenty of visibility into container level metrics like memory or CPU.. It has out of the box observability of Cloud Foundry, Kubernetes, Redis, and many more.
The best part about Wavefront is that there is now a freemium offering. This offering doesn't even require a sign-up.
In many cases, it is worthwhile to look deeper. Instrumenting your application can help. With Spring Boot Actuator and Micrometer collecting internal metrics is simple as adding some project dependencies.
Micrometer
The Spring Boot platform has long taken an opinionated stance while still allowing choice. The Spring Boot Actuator is a Boot addon that allows for production-ready features such as liveness checks, health checks, and metrics.
The Actuator is built on a tool called Micrometer a vender neutral tool for collecting and transmitting metrics. Several "reporters" are available for Micrometer, including Prometheus, Datadog, Dynatrace, and Wavefront.
How to set up your boot project
This page was converted from my old blog and hasn't been reviewed. If you see an error please let me know in the comments.
Prerequisites
- Spring Boot 2.3 or later
- Project Configured with Spring Boot Actuator
If you are starting a new project, the Spring Initializer can be used to quickly generate the project scaffolding. Under application dependencies, you can select "Wavefront." Selecting this dependency adds the proper dependencies to your project.with everything you need to start.
There are a few things to add to your maven pom if you are adding the starter to your existing project. The Spring Pet Clinic is an excellent place to start if you want to work with a fully built out application.
-
Check your spring version. You need at least version 2.3.0 or later.
1<parent> 2 <groupId>org.springframework.boot</groupId> 3 <artifactId>spring-boot-starter-parent</artifactId> 4 <version>2.3.0.RELEASE</version> 5 <relativePath/> 6 <!-- lookup parent from repository --> 7</parent> -
Add Wavefront version property.
1<properties> 2 <java.version>1.8</java.version> 3 <spring-cloud.version>Hoxton.RELEASE</spring-cloud.version> 4 <wavefront.version>2.0.0</wavefront.version> 5</properties> -
Ensure your maven pom uses the spring milestone repository. If you are using a corporate maven repository, make sure the jars you need are installed or that the corporate repository mirrors the Spring milestone repository.
1<repository> 2 <id>spring-milestones</id> 3 <name>Spring Milestones</name> 4 <url>https://repo.spring.io/milestone</url> 5 </repository> -
Add the Wavefront starter
1<dependency> 2 <groupId>com.wavefront</groupId> 3 <artifactId>wavefront-spring-boot-starter</artifactId> 4</dependency> -
Add the Wavefront BOM to the dependency management section.
1<dependency> 2 <groupId>com.wavefront</groupId> 3 <artifactId>wavefront-spring-boot-bom</artifactId> 4 <version>${wavefront.version}</version> 5 <type>pom</type> 6 <scope>import</scope> 7</dependency> -
Add the following properties to your
application.properties1wavefront: 2application: 3 name: jellin-demo 4 service: hop2
The application name is the name of your application. the service is the name of the component. In this case hop2 is a microservice in part of a larger microservice architectured system.
Once you start the application, you should see a link to a one-time login to a wavefront account. This link gives you access to a freemium wavefront account that you can use to view your metrics.
1Connect to your Wavefront dashboard using this one-time use link:
2https://wavefront.surf/us/K3sikjk
How to view metrics
Once you are in Wavefront you can look for metrics that your application is sending.
select Browse->Metrics
You should be presented with a list of metrics. You can then drill through a hierarchal list of metrics to find what you are looking for.
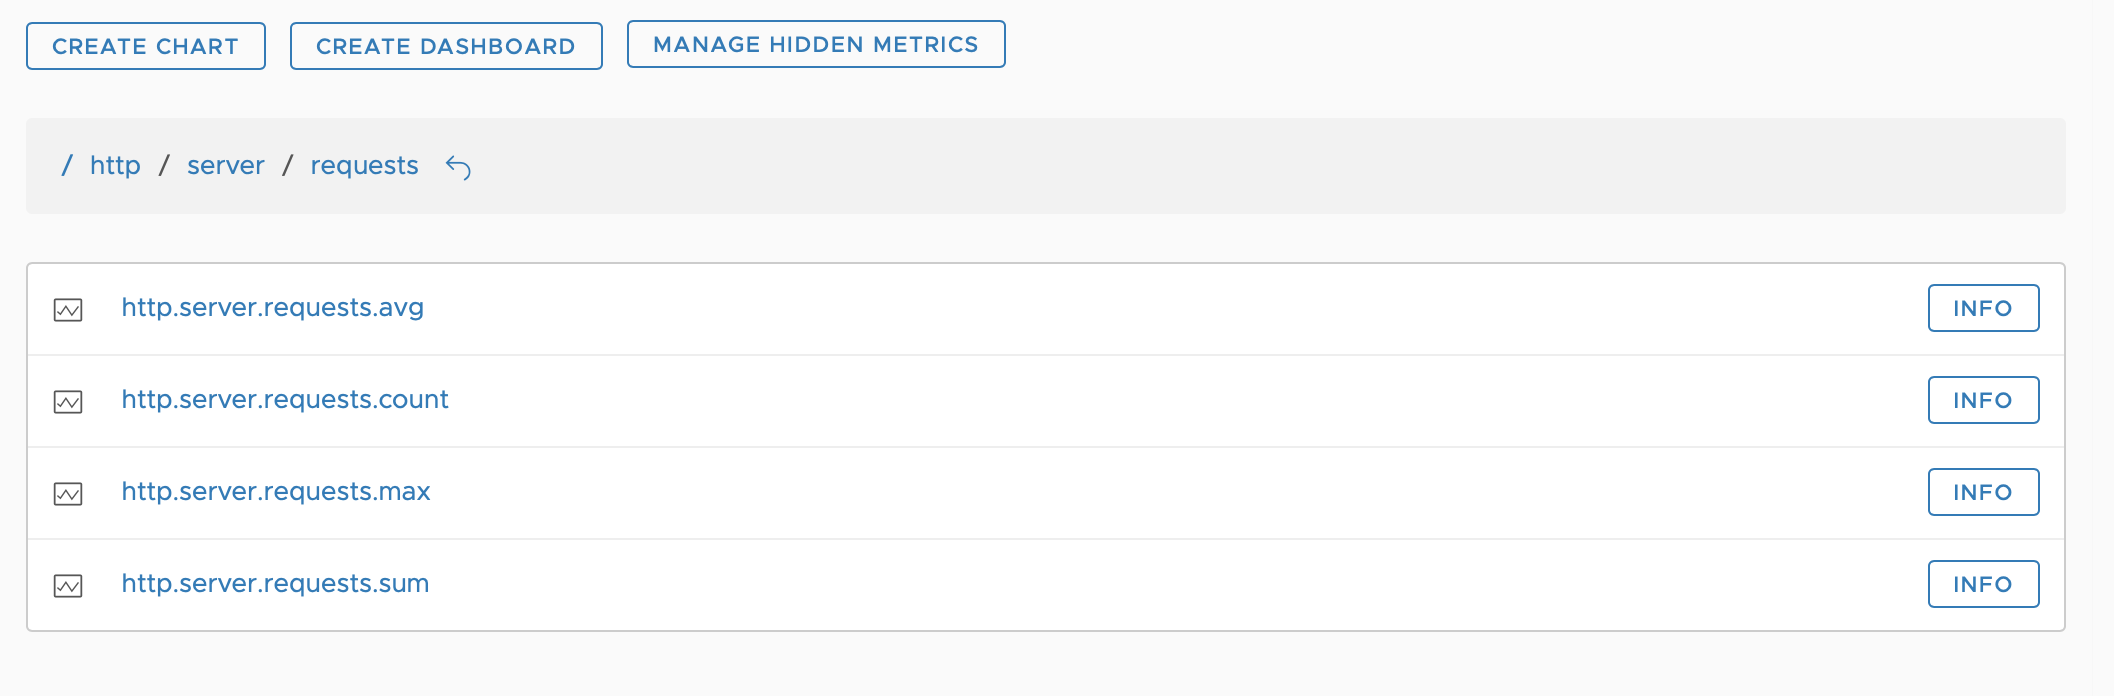
e.g. http.server.requests.avg
Sending Spans
Wavefront currently includes a default application dashboard. Navigating to Applications->Application Status look for your application. Clicking here will reveal all services that are part of your application.
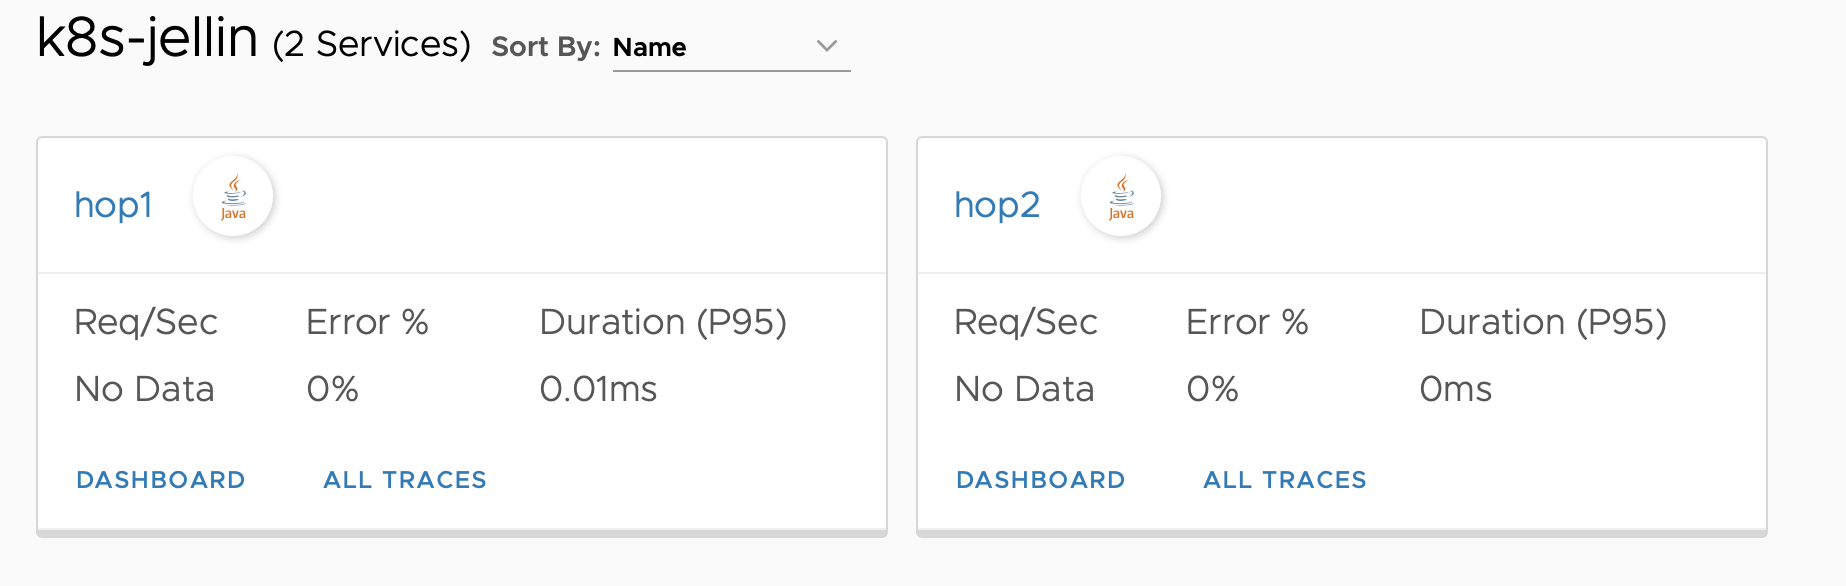
This dashboard is built off of application spans generated by either Sleuth or Open Tracing. If you have neither of these on your classpath, this dashboard is likely to be empty.
Adding slueth should result in tracing data being sent to Wavefront.
1<dependency>
2    <groupId>org.springframework.cloud</groupId>
3    <artifactId>spring-cloud-starter-sleuth</artifactId>
4</dependency>
How to calculate the 90 Percentile within Wavefront.
One common scenario is calculating the 90th percentile of inbound or outbound requests. Spring Actuator can send percentiles calculated on the client. Doing this calculation client-side is generally not recommended because as you scale your application, there may be multiple nodes serving the same requests. How can you rationalize the 90th percentile of 3 nodes into a single number?
Instead, it is recommended that you send the raw data required to the analysis tool so that you can calculate the 90th percentile across all nodes. Spring Actuator can send histograms used for thee calculations,
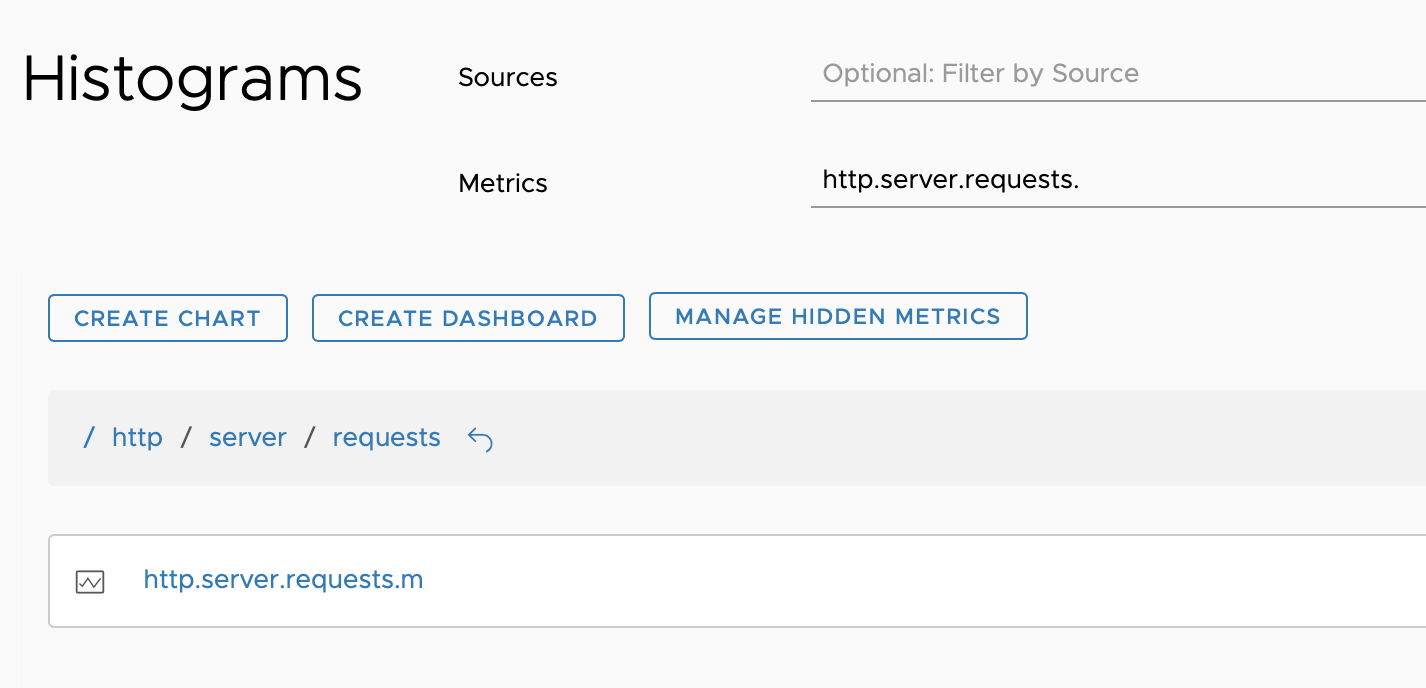
Histograms can be enabled on a per metric basis via Spring application.properties file.
1management:
2  metrics:
3    distribution:
4      percentiles-histogram:
5        http.server.requests: true
6        http.client.requests: true
This snippet enables histograms for the two metrics http.server.requests and http.client.requests
Restart your app and navigate to Browse->Histograms
The following query returns the 90th percentile of all the incoming server requests..
1percentile(90,hs("http.server.requests.m", application=k8s-jellin))
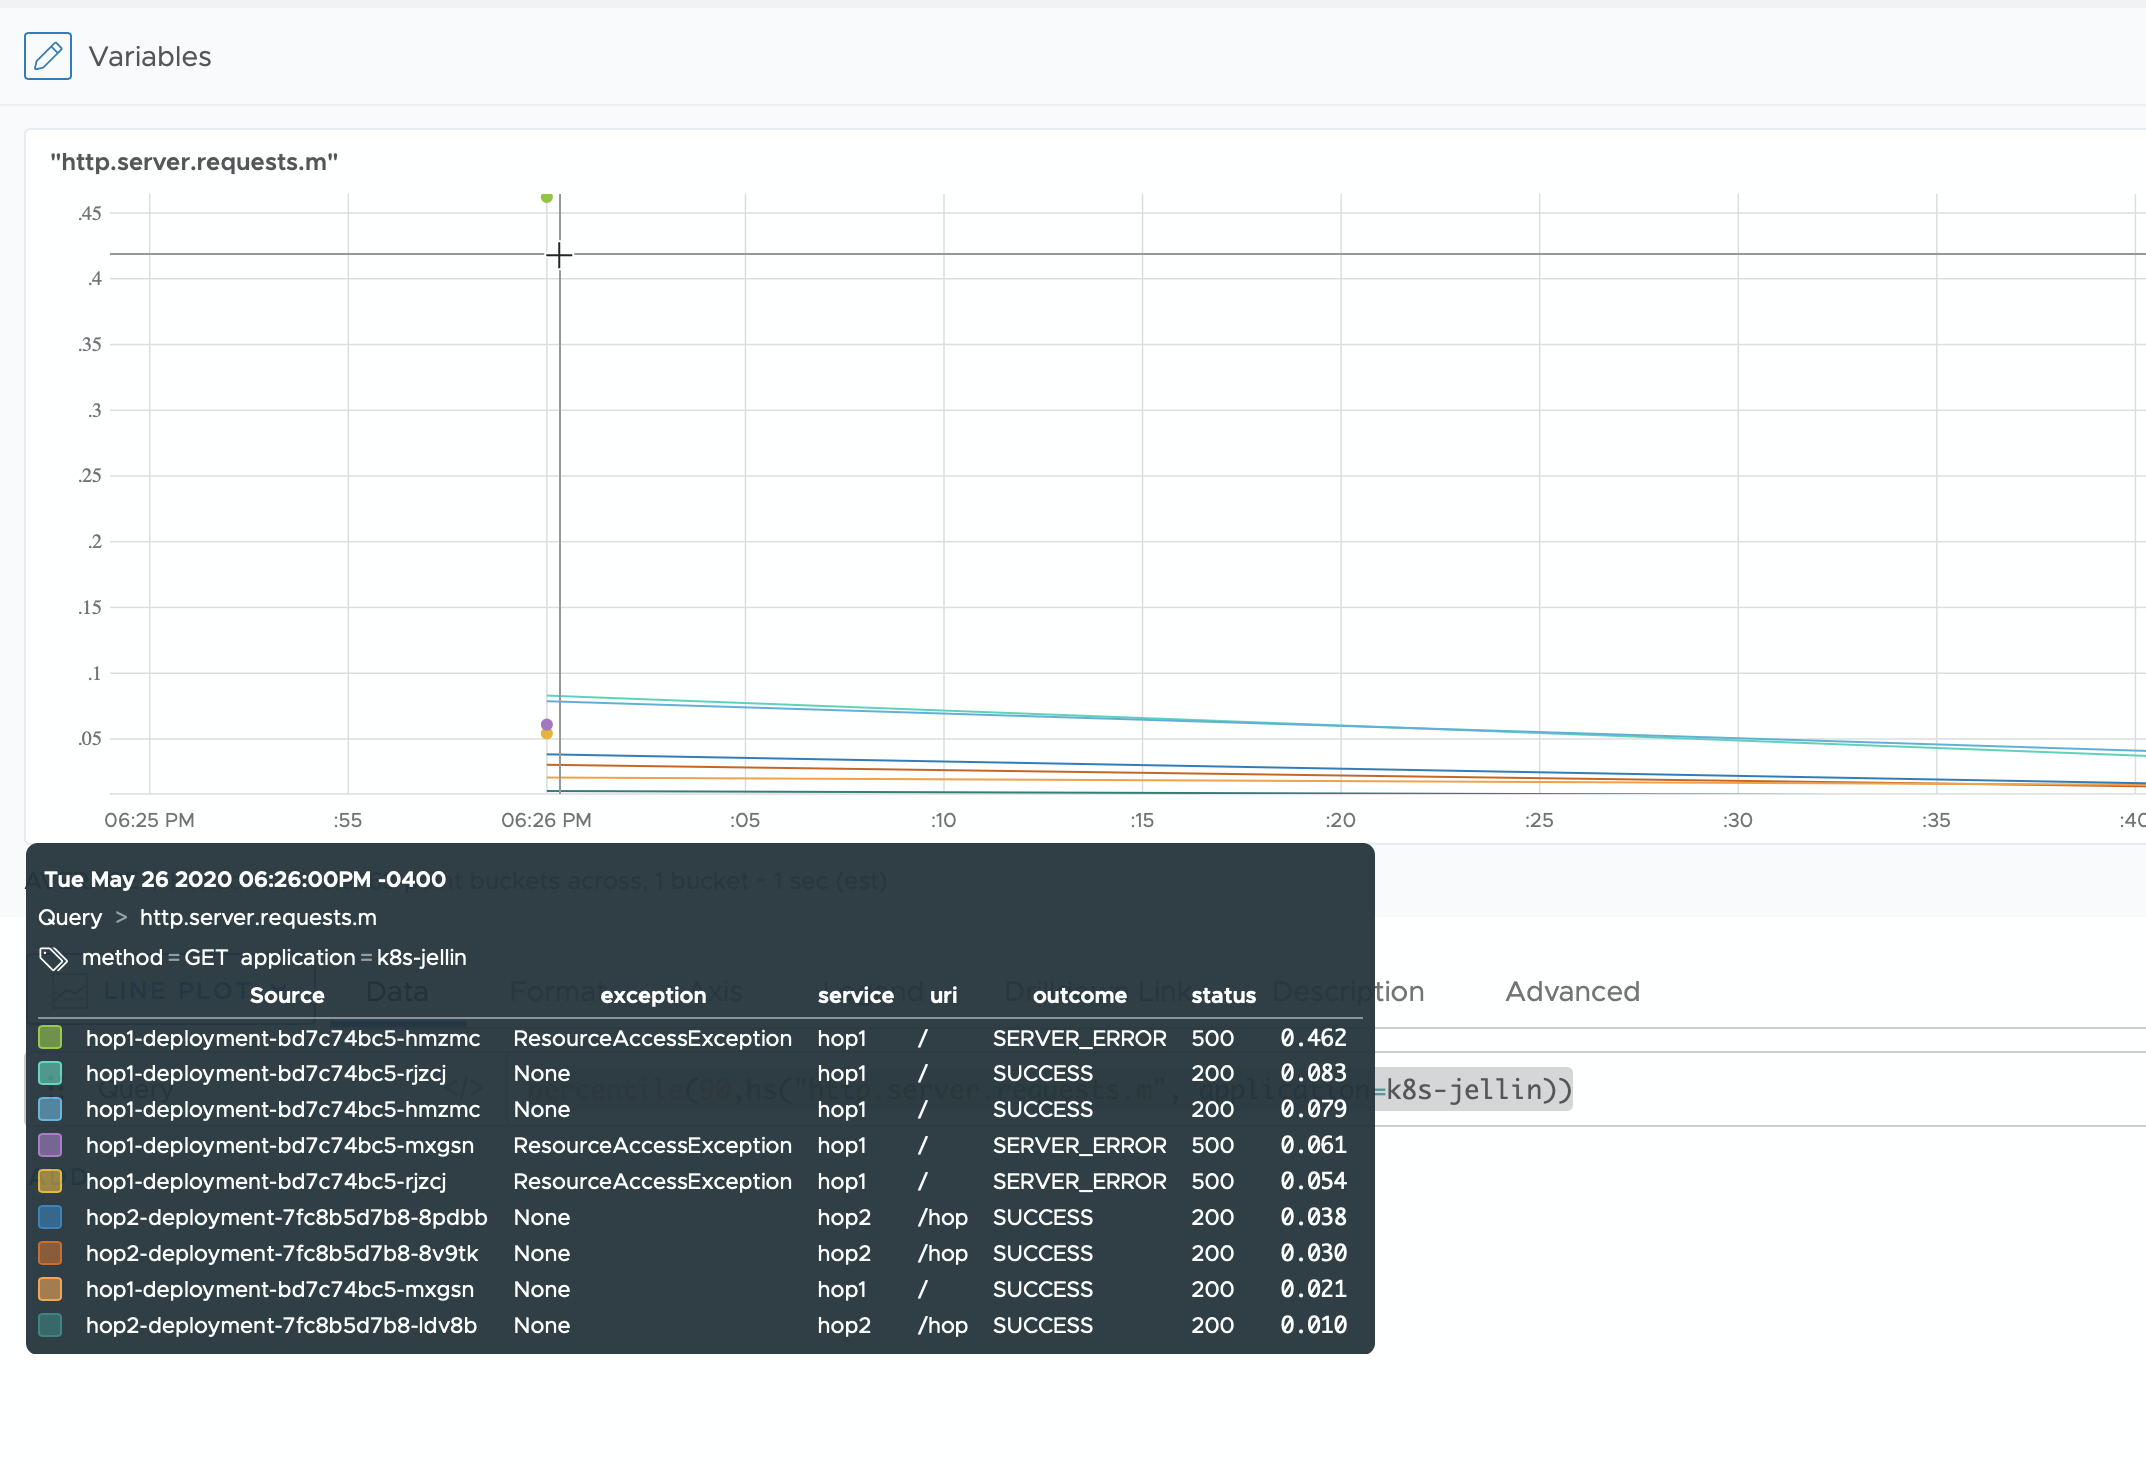
The application in the query above filters your result by that application only. You should have one line in the chart for each URI and Datasource.
You can merge the histograms by service.
1percentile(90,merge(hs("http.server.requests.m", application=k8s-jellin),service))
or by service AND uri
1percentile(90,merge(hs("http.server.requests.m", application=k8s-jellin),service,uri))
References
Official Spring Boot Tutorial for Wavefront
BYO Spring Boot Apps: Tanzu Observability for Free, No Sign-up Needed